Dairy Industry
Measure the percentage of fat, protein and dry matter in milk directly in the process.
Dairy Industry
Dairy Industry Applications
Milk Analysis with the TIDAS P Milk Inspector
In Cooperation with the German Schwarzwald Milch GmbH a milk analysis system was developed, which is able to measure the percentage of fat, protein and dry mass in milk with a low cost. The nutritional value of milk is determined by fat, protein and lactose. Therefore our goal was to develop a solution which measures the fat and protein content continuously during the processing of the milk in the dairy. Since laboratory methods do not meet the modern requirements for speed and cost efficiency, our focus was on developing a solution directly for the process.

Taking the given limitations into consideration, three measurement methods were examined:
| MIR [4000-400 cm-1] | NIR [1100-2500 nm] | VIS/SW-NIR [380-1050 nm] | |
|---|---|---|---|
| Principle | Absorption (base line frequencies) | Absorption | Scattering by fat and protein particles |
| State of the Art | Industrial lab standard | Rare in practice | TIDAS P Milk Inspector |
| In-line Analysis | Challenging / unknown | Possible | Easy |
| Features | High-tech automation | Complicated by strong absorption of water | Inexpensive, flexible |
It was decided to develop the system with the VIS/SW-NIR method. The VIS/SW-NIR spectroscopy (380-1050nm wavelength) is economically attractive because inexpensive light sources, light guides and detectors can be used. The measurement principle is based on the scattering properties of milk.
Composition and Structure of Milk
Milk is an emulsion or colloidal dispersion of proteins, lactose and fat in water and consists of the following components:
Average Components of Milk
| Component | Average (%) | Range (%) |
|---|---|---|
| Water | 87,1 | 85,3 - 88,7 |
| Lactose | 4,6 | 3,8 - 5,3 |
| Fat | 4,0 | 2,5 - 5,5 |
| Protein | 3,3 | 2,3 - 4,4 |
| Casein | 2,6 | 1,7 - 3,5 |
| Minerals | 0,7 | 0,57 - 0,83 |
| other | < 1 | - |

Milk is an amorphous system consisting of fat globules (1-10µm) and protein micelles (80-200nm).
During transmission measurements the detected intensity is inversely dependent on the scattering strength and therefore on the particle density. Differently sized fat and protein particles have different spectral patterns; they can be quantified using multivariate data analysis.
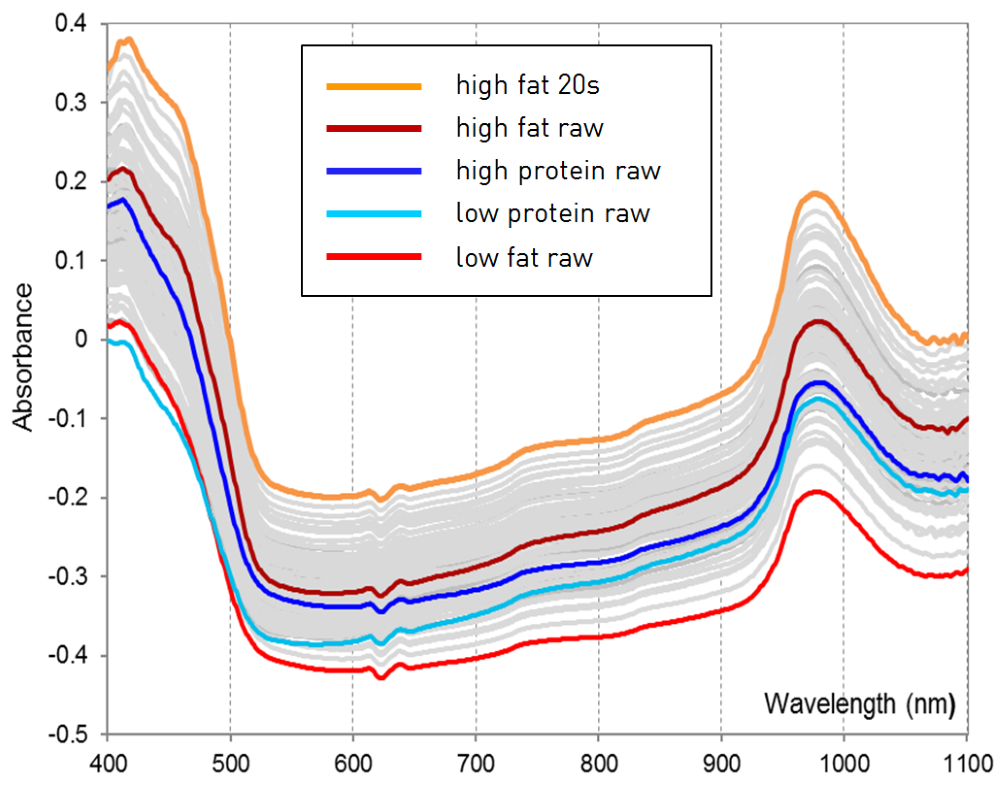

Ambient light penetrates the milk and is reflected, absorbed and transmitted through the milk.

It is noticeable that the transmission with low fat percentages is better, compared to higher fat percentages.
Configuration of the System
To make use of the above presented properties a J&M TIDAS P Process spectrometer with a higher dynamic range in combination with an immersion probe certified for usage with food, which is directly inserted in the process pipe, was utilized.

Furthermore, a computer with J&M TIDASDAQ3 software and a process monitoring interface was used. The monitoring, with this configuration, can be done via process control or mobile terminals.

A prediction model was programmed in TIDASDAQ3. The prediction model is calibrated with samples taken directly from the process. This guarantees an optimal configuration to the homogenizer and the specific process line in general. Transfer functions allow an easy installation of the prediction models on different spectrometers. A special valve facilitates the sampling for reference analytics to fine-tuning the prediction model.
Virtues of In-Line Monitoring
The In-line monitoring has huge advantages compared to laboratory measurements of samples: measurements can be done very quickly, every two seconds in real time. This way, a more accurate product mixture can be guaranteed. In case there are any deviations, a more effective reaction in a shorter time frame is possible. That means a better understanding of the production process, an improved quality of the final product, as well as a cost reduction during the process.
With the described system a high accuracy of prediction is possible. With fat and dry mass, the deviation is only about 0.05%, with proteins even less at 0.03% (see pictures below ):


On the left side the actual measurement can be seen. On the right side the corresponding prediction models can be seen.
| Color | Components |
|---|---|
| red | fat |
| blue | protein |
| green | dry mass |
VIS/SW-NIR vs. Conventional Analysis
The VIS/SW-NIR analysis compared to NIR/MIR methods has a very good cost-benefit-ratio. NMOS and CCD sensors are very stable and less expensive, compared to InGaAs sensors, which are used in NIR systems. A further advantage is that the VIS technology can be easily implemented in the production site. Here, samples do not have to be homogenized or tempered. Furthermore, the VIS-technology is highly flexible, because of a big selection of optical components and detectors, and therefore can be more easily adapted to different analytical uses.
